Spring 2018
Course: Information Visualization
Group project with: Susanne Stubberud Rom, Madeleine Sjøseth Pedersen and Vilde Frang Høvik
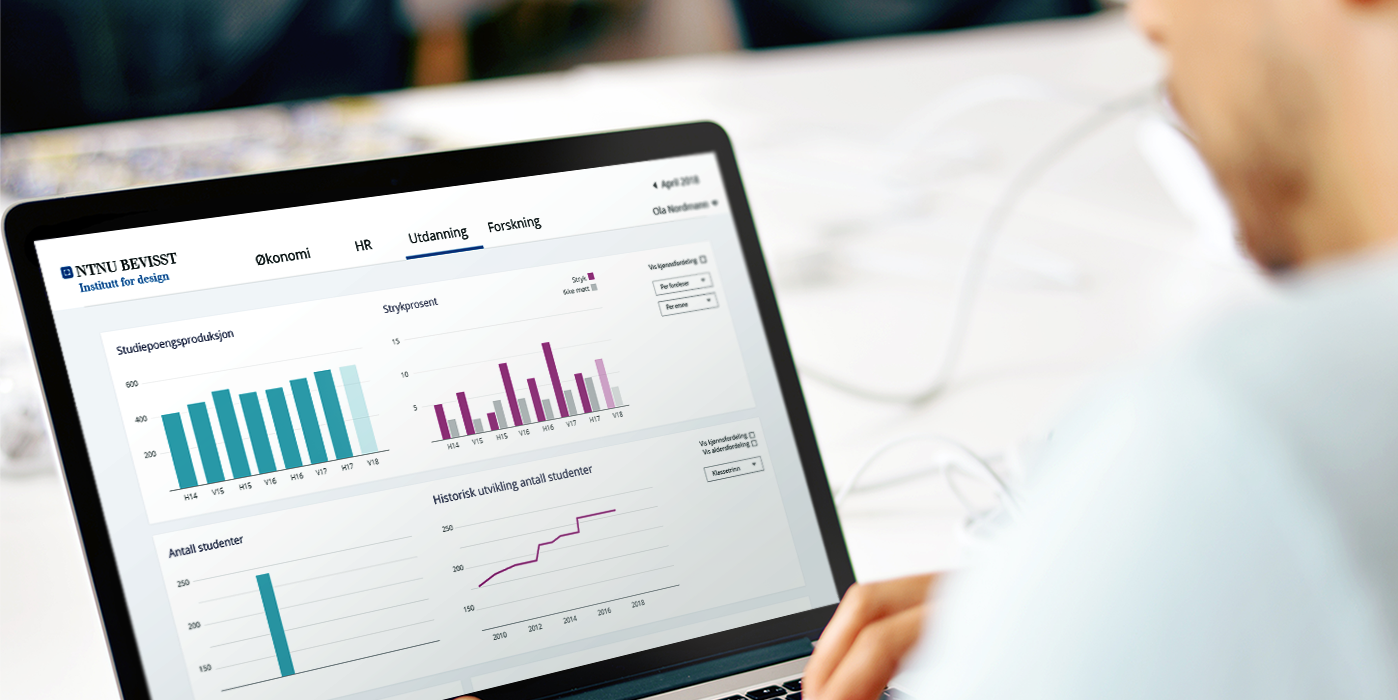
In the course information visualization we had a 2 month project with NTNU BEVISST that works with control systems for NTNU management. Our chosen task was to create a new design for the web based monthly report on BEVISST Governance.
How can the Head of Department get a more meaningful overview of the status of their Department through the BEVISST Governance monthly report?
 Design principles from Colin Wares “Information Visualization” was essential for this project, seeking to visualize data in a readable and comprehensive way.
 Two Head of departments and an administrative employee participated in usability tests, which provided useful feedback for improvements. Although there were some things that should be improved, most people were generally satisfied and found our prototype to be more user friendly than the current report. Most of the testers were also pleased with the range of information.